2019 goes down as the third wettest on record with plenty of extreme temps


Welcome to a new year! Welcome to a new decade! Welcome to January! 2019 is officially in the books and it had a little wild weather. Fresh in our memory is the snowiest Halloween on record followed by a green Christmas, but we had plenty of extremes before that.
Remember last January? It was super snowy with over 20" of snow, but also a historic cold blast to end the month. We saw the coldest wind chill of the year on January 30 when it hit -47°. Compare that to the high heat we had in July when the heat index hit 107° on July 19. Our extreme temp swing was 154°.

2019 was also a very wet year. Out of the 12 months of the year only five of them were below-average on rainfall and none by more than an inch. February and May were very wet but not nearly as wet as September and October. February was the 7th wettest on record, May was the 11th wettest on record, September was the 8th wettest on record and October was the 3rd wettest on record. Below is a listing of all the months and their precipitation. When you crunch all the numbers 2019 ended with 46.02" of precipitation which is good enough for the third wettest year on record and very close to the second wettest spot. The year ends 11.26" above the average yearly precipitation of 34.76". 2018 was also a very wet year.
January: 2.23" (0.47" above-average)
February: 3.33" (1.68" above-average)
March: 1.64" (0.63" below-average)
April: 3.77" (0.21" above-average)
May: 6.32" (2.92" above-average)
June: 4.42" (0.52" above-average)
July: 3.17" (0.50" below-average)
August: 3.53" (0.44" below-average)
September: 7.00" (3.82" above-average)
October: 6.48" (3.83" above-average)
November: 2.14" (0.57" below-average)
December: 1.96" (0.08" below-average)

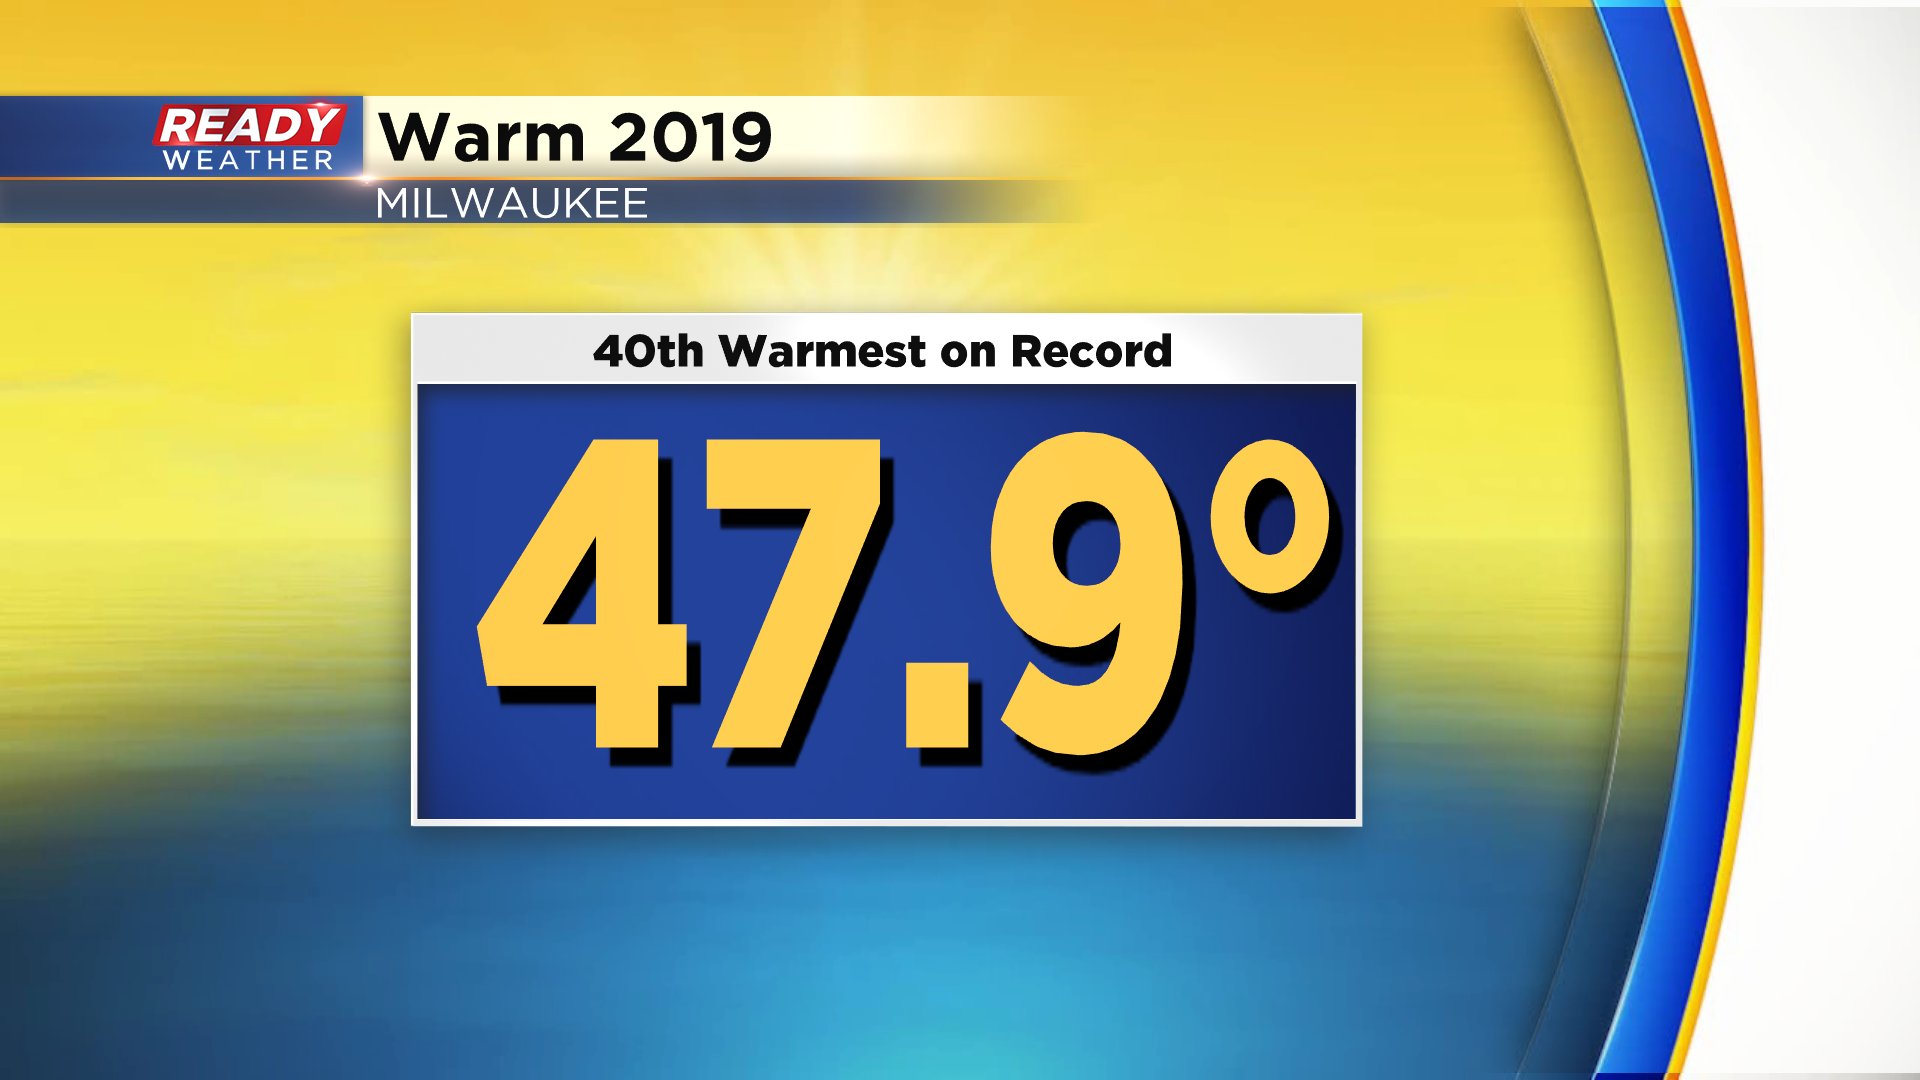
In addition to being wet, 2019 was also warmer than average. The average temperature through the whole year was 47.9° which is good enough to go down tied as the 40th warmest on record out of 148 years of data.
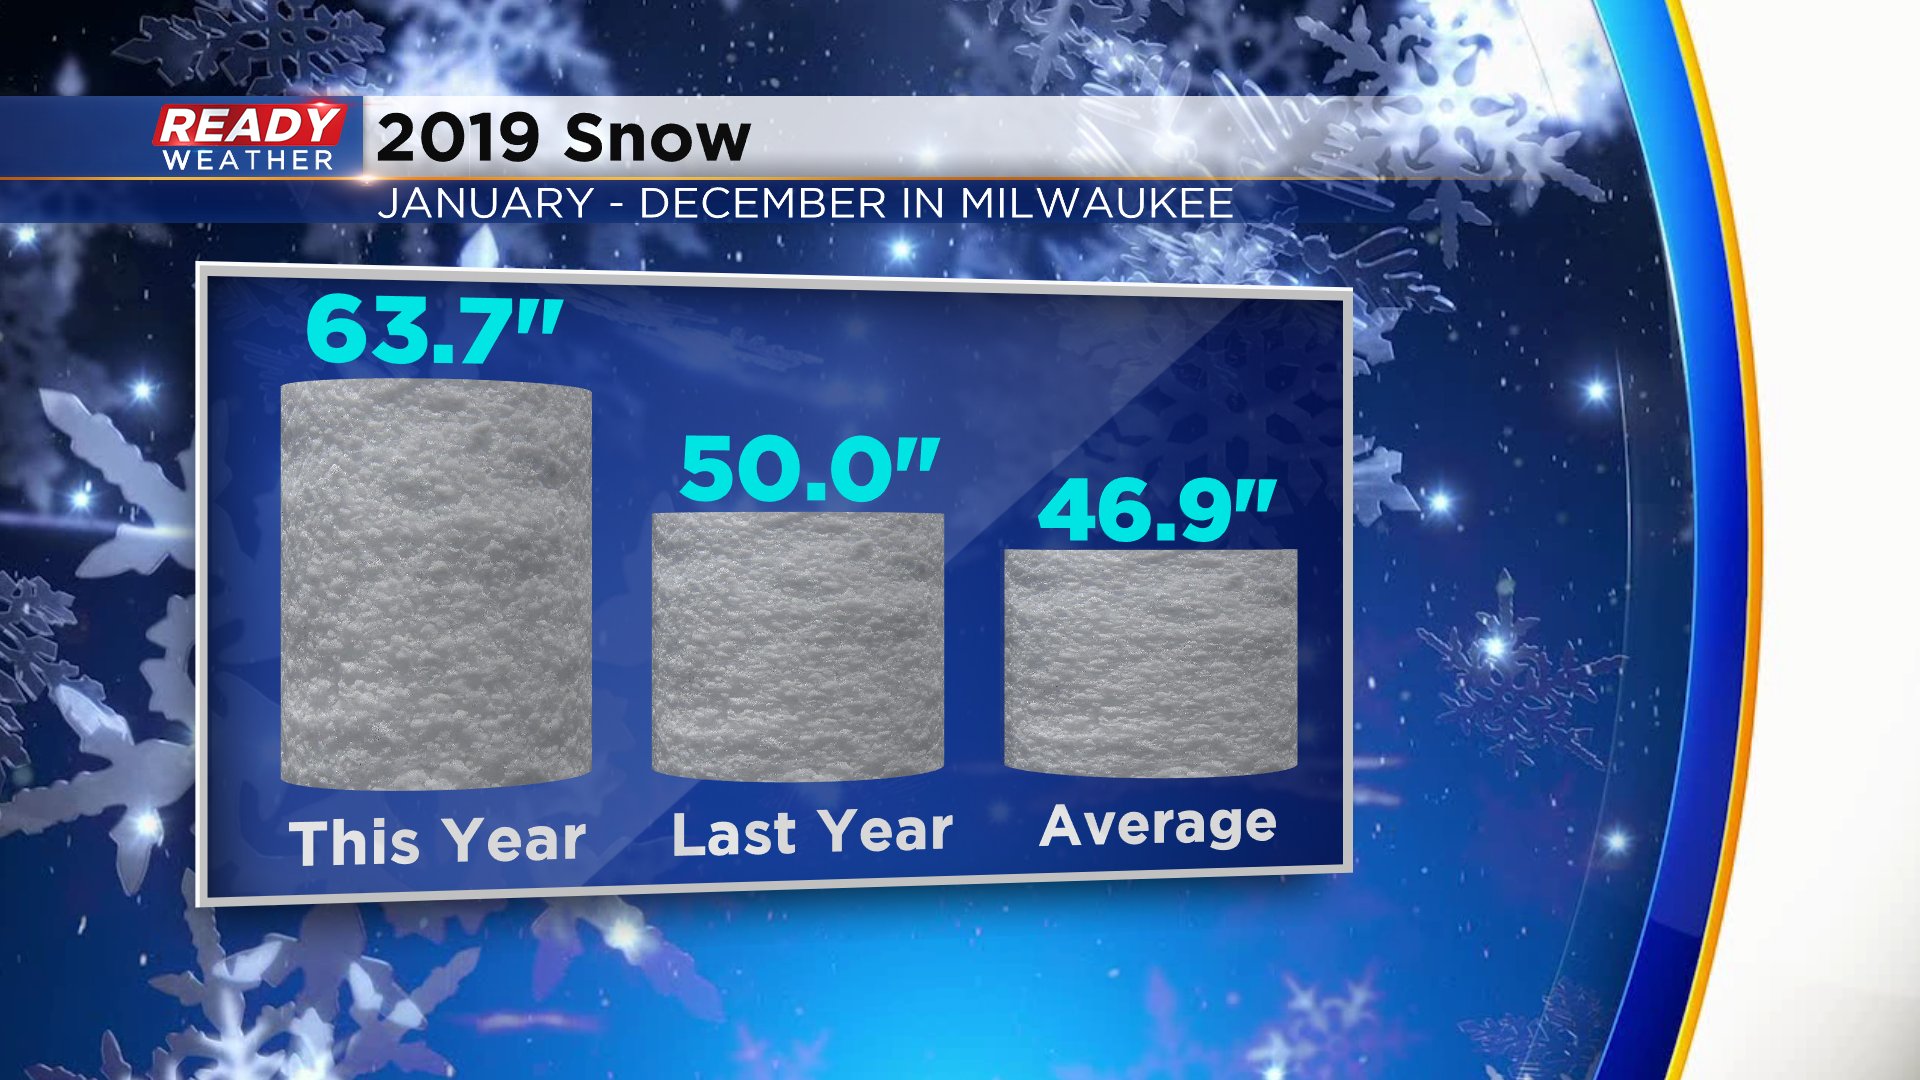
And 2019 was snowy. We typically talk about snow stats during the context of winter usually from October to April but you can also look at yearly stats from January to December. January and February 2019 kicked off the snowy year with nearly 40" of snow just those two months. March was lacking on snow but for the second year in a row we had a very snowy April. The year ended with a very snowy October and beginning to November before drying out over the past 6 weeks. All in all 2019 saw 63.7" of snow which is 16.8" above the average yearly snowfall of 46.9".
Download the CBS 58 Ready Weather App to see how January is shaping up and when that next chance for snow arrives.